
Introduction to Data Engineering Projects
Importance of Hands-On Projects for Beginners
Practical projects help beginners apply what they’ve learned in theory to real-world scenarios.
Key Points:
- Reinforces understanding of concepts like ETL, pipelines, and data transformation
- Builds confidence in working with real datasets
- Prepares learners for challenges they may face in professional environments
Difference Between Theoretical Learning and Practical Application
While theoretical knowledge provides a foundation, hands-on projects show how concepts work in practice.
Key Points:
- Theoretical Learning: Focuses on understanding definitions, workflows, and tools
- Practical Application: Involves building pipelines, cleaning datasets, and automating workflows
- Projects expose learners to errors, debugging, and problem-solving that theory alone cannot provide
Benefits of Completing Small Projects
Starting with small, manageable projects offers multiple advantages for beginners.
Key Benefits:
- Skill-Building: Strengthens programming, SQL, and data manipulation abilities
- Portfolio Development: Demonstrates practical experience for potential employers
- Confidence Boost: Allows learners to see tangible results from their work
- Better Understanding of Workflows: Provides insight into real-world data challenges and solutions
Core Concepts Covered in Beginner Projects

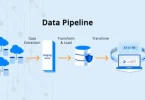
1. Data Pipelines
Beginner projects introduce learners to building simple pipelines that move data from source to destination.
Key Activities:
- Extract data from files, databases, or APIs
- Transform data by cleaning, aggregating, or formatting
- Load processed data into storage systems for analysis
2. ETL vs ELT
Projects help beginners understand the differences between ETL and ELT processes.
ETL (Extract, Transform, Load)
- Transformations occur before loading data into storage
- Suitable for structured datasets and traditional analytics
ELT (Extract, Load, Transform)
- Data is loaded first, then transformed in storage
- Useful for large datasets and cloud-based data warehouses
3. Data Cleaning and Transformation Basics
Working with real datasets teaches essential cleaning and transformation techniques.
Key Tasks:
- Remove duplicates and handle missing values
- Standardize data formats and types
- Aggregate, filter, and join data from multiple sources
4. Basic Data Analytics and Visualization
Projects often include simple analysis to derive insights from data.
Key Activities:
- Calculate summaries and basic statistics
- Identify patterns or trends in the data
- Create charts, graphs, and dashboards for visualization
5. Automation of Repetitive Tasks
Beginner projects demonstrate how automation improves efficiency.
Key Activities:
- Schedule ETL scripts using Python or workflow tools
- Automate report generation or data cleaning tasks
- Reduce manual intervention and human errors
Suggested Beginner Project Ideas

a. Data Cleaning & Transformation
Learn to prepare raw datasets for analysis by cleaning and formatting them.
Tasks:
- Remove duplicates and handle missing data
- Standardize and normalize columns and formats
Tools:
- Python (Pandas), Excel, SQL
b. CSV to Database ETL Project
Practice moving data from flat files into relational databases while transforming it.
Tasks:
- Load CSV files into SQL databases
- Apply transformations during the load process
Tools:
- Python, PostgreSQL, SQLite
c. Automating Reports
Learn how to automate repetitive reporting tasks for efficiency.
Tasks:
- Generate daily or weekly reports automatically
- Schedule tasks using scripts or cron jobs
Tools:
- Python, schedule library, email automation
d. Data Aggregation & Analytics
Gain experience summarizing and visualizing data for insights.
Tasks:
- Aggregate datasets using groupby and other functions
- Visualize trends with charts and graphs
Tools:
- Python, Matplotlib, Seaborn
e. Simple Data Pipeline Project
Build an end-to-end data pipeline to understand the flow of data.
Tasks:
- Ingest data, transform it, and store it in a database
- Implement either batch or real-time pipelines
Tools:
- Python, SQL, Airflow (optional for orchestration)
f. API-Based Projects
Practice working with external data sources and integrating them into pipelines.
Tasks:
- Fetch data from APIs (e.g., weather, stock, public datasets)
- Transform, store, and visualize the data
Tools:
- Python, requests library, database
Step-by-Step Workflow for Beginners
Step 1: Identify Project Goal and Dataset
Start by defining the objective and selecting a dataset that aligns with your goal.
Key Actions:
- Choose a clear and simple project goal
- Select beginner-friendly datasets (CSV, Excel, or public APIs)
- Understand the data source and its structure
Step 2: Explore and Clean the Data
Ensure your dataset is accurate, consistent, and ready for analysis.
Key Actions:
- Inspect data for missing or inconsistent values
- Remove duplicates and irrelevant columns
- Standardize data types and formats
Step 3: Transform and Prepare the Data for Storage
Prepare the data for efficient storage and further analysis.
Key Actions:
- Aggregate or filter data as needed
- Join tables or datasets if required
- Apply calculations or derive new columns
Step 4: Load Data into a Database or Storage System
Move the cleaned and transformed data into a storage solution.
Options:
- Local databases like SQLite or PostgreSQL
- Cloud solutions like Google BigQuery
- Flat files like CSV or Excel for lightweight projects
Step 5: Aggregate, Analyze, or Visualize Data
Turn raw data into meaningful insights.
Key Actions:
- Summarize data using aggregation functions
- Create visualizations such as charts, graphs, or dashboards
- Use tools like Python (Matplotlib/Seaborn) or Tableau
Step 6: Automate Repetitive Tasks
Save time by automating workflows that occur regularly.
Key Actions:
- Schedule Python scripts for daily/weekly updates
- Automate data cleaning, aggregation, or reporting tasks
- Use libraries like schedule or cron jobs
Step 7: Document Workflow and Result
Maintain clarity and reproducibility of your project.
Key Actions:
- Write clear notes on each step of the process
- Document assumptions, transformations, and calculations
- Save scripts, queries, and visualizations for future reference or portfolio
Tools & Technologies for Beginners
1. Programming Tools
Programming is essential for data manipulation, ETL, and automation.
Python
- Widely used for scripting, data processing, and building pipelines
- Beginner-friendly with extensive libraries
SQL
- Core language for querying and managing relational databases
- Essential for extracting, filtering, and aggregating structured data
2. Data Manipulation Tools
These libraries simplify working with datasets and performing transformations.
Pandas
- Powerful Python library for data cleaning, transformation, and analysis
- Provides dataframes for structured data
NumPy
- Efficient numerical computations and array operations
- Supports statistical and mathematical operations on data
3. Database Tools
Databases store and manage structured data for analysis and reporting.
SQLite
- Lightweight, beginner-friendly relational database
- Easy to set up for practice projects
PostgreSQL & MySQL
- Full-featured relational databases
- Suitable for more advanced or scalable projects
4. Automation Tools
Automation helps reduce repetitive tasks and ensures consistency.
Python Schedule Library
- Schedule scripts to run at specific times
- Automates ETL tasks, data cleaning, or report generation
Cron Jobs
- Linux-based task scheduler
- Automates scripts or commands at defined intervals
5. Visualization Tools
Visualizations help interpret data and communicate insights effectively.
Matplotlib & Seaborn
- Python libraries for creating charts, plots, and statistical visualizations
Tableau
- Beginner-friendly drag-and-drop interface for building interactive dashboards
- Ideal for reporting and visual analysis
You may also like to read these posts:
Beginner’s Guide to Managed IT Services for Smart Business Growth
Best Cloud Storage Options for Businesses & Individuals
Easy Core Java Tutorials for Beginners to Start Coding
System Architecture Design Tips for Building Better Systems
Common Challenges Beginners Face
1. Working with Messy or Incomplete Datasets
Beginners often encounter datasets with missing, inconsistent, or duplicated values.
Key Issues:
- Null or missing entries
- Duplicate records
- Inconsistent formats across columns or files
2. Understanding ETL Processes
Learning the flow of Extract, Transform, and Load (ETL) can be confusing for beginners.
Key Issues:
- Determining the correct sequence of ETL steps
- Knowing which transformations to apply and when
- Differentiating between ETL and ELT approaches
3. Automating Tasks Reliably
Automation is essential for efficiency but can be tricky to implement correctly.
Key Issues:
- Scheduling scripts without errors
- Handling unexpected data or edge cases
- Monitoring automated workflows for failures
4. Debugging Pipeline Errors
Beginners may struggle to identify and fix issues in their pipelines.
Key Issues:
- Syntax or logic errors in code
- Failed database connections or query issues
- Errors caused by unexpected data formats
5. Scaling Small Projects to Larger Datasets
Moving from small practice datasets to real-world larger datasets introduces performance challenges.
Key Issues:
- Slow queries or processing times
- Memory or resource limitations on local machines
- Learning to optimize pipelines for efficiency and scalability
Faqs:
What are some beginner data engineering projects?
Projects like data cleaning, CSV to database ETL, automating daily reports, aggregating data, and building simple pipelines are ideal for beginners.
Do I need coding skills to start these projects?
Yes, basic skills in Python and SQL are recommended to handle data transformations, ETL workflows, and automation tasks.
Can beginners practice with free datasets?
Absolutely. Public datasets from Kaggle, government portals, or APIs are perfect for hands-on practice.
How can beginners automate tasks in these projects?
Using Python scripts combined with scheduling tools like schedule or cron jobs can automate repetitive tasks such as data cleaning, report generation, or database updates.
How do these projects help in building a data engineering career?
They provide practical experience, improve understanding of real-world data workflows, and can be showcased in a portfolio for job opportunities.
Conclusion
Working on beginner data engineering projects is the best way to gain hands-on experience and develop practical skills in handling real-world data. Starting with small projects like data cleaning, ETL pipelines, automation, and basic analytics allows beginners to build confidence and understand essential workflows. Consistent practice with these projects will help you create a strong foundation in data engineering, prepare you for advanced projects, and showcase your skills to potential employers.